Cloudera Navigator Auditing
Cloudera Navigator auditing has been designed to meet demanding corporate governance and compliance requirements, especially for organizations in regulated industries. The Navigator Audit Server collects audit events from selected cluster services. Authorized users can use the Cloudera Navigator console to display audit event reports, create reports, and export audit details as CSV or other file formats. They can also search using configurable filters—a specific user name, IP address, or service name, for example—to quickly obtain answers to a variety of questions (see Using Audit Events to Understand Cluster Activity for details).
Audit details for HDFS, the distributed storage layer that underlies any Hadoop cluster, are also characterized using histograms and other graphical charts that can be seen in the analytics area of the Cloudera Navigator console.
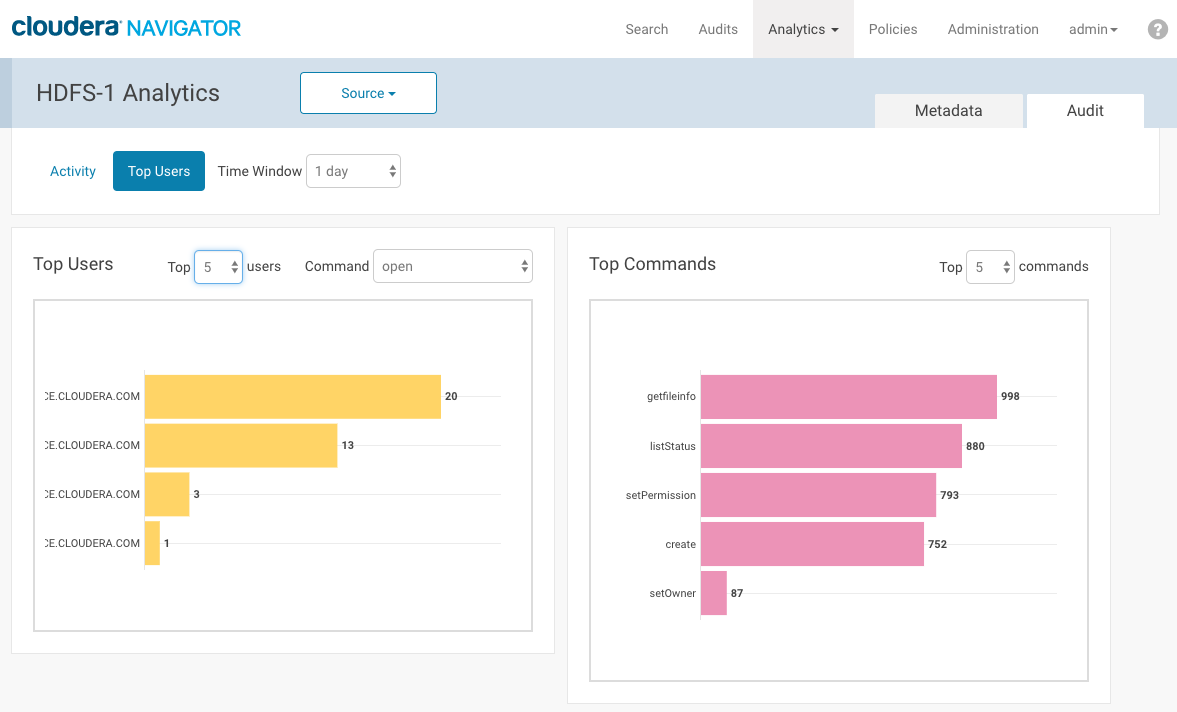
 Fastpath: For a high-level view of cluster data utilization and consumption, display the
top users of your cluster:
Fastpath: For a high-level view of cluster data utilization and consumption, display the
top users of your cluster:
- Log in to the Cloudera Navigator console using an account that has the Auditing Viewer user role (or Full Administrator).
- Select
- Click the Audit tab.
- Click the Top Users button.
Events are the activities that occur during regular operations within the cluster. Events often result in messages that record the success or failure of activity along with other relevant details about the specific internal process, such as a hostname, IP address, or service name. Event messages from various services are typically sent to local log files, and from there, the Cloudera Manager Agent process sends them to the Navigator Audit Server (see Navigator Auditing Architecture for details).
In addition to individual service events audited by Cloudera Navigator, Cloudera Manager Server records lifecycle events at the cluster, host, role, service, and user level, and records actions that involve licenses and parcels. For example, starting up the cluster is a lifecyle event captured by Cloudera Manager, as is downloading a parcel to update software. Cloudera Manager also captures security-related events, such as adding users, deleting users, login failures, and login successes. For more information about Cloudera Manager auditing capabilities, see Lifecycle and Security Auditing.
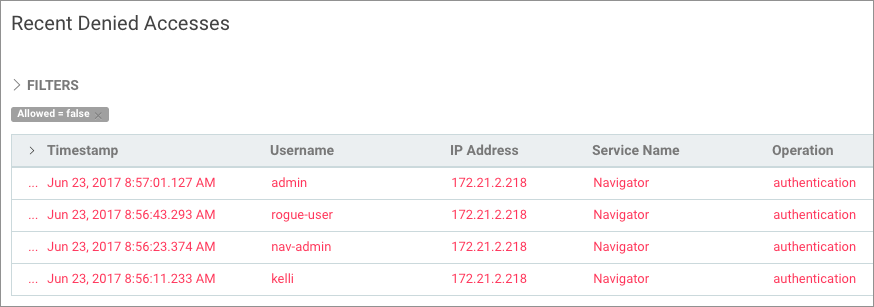
Cloudera Navigator tracks and coalesces events collected by Cloudera Manager and generates some of its own events as well. Audit events are viewable in the Cloudera Navigator console. Several pre-configured reports are available from the Audit tab of the Cloudera Navigator console, where you can also filter for specific types of events, create new reports, and export detailed audit reports as CSV or JSON. For example, here is a partial export of Recent Denied Accesses—user accounts without sufficient privileges (user roles) that attempted to log in to Cloudera Navigator but were prevented from doing so:
Viewing Audit Analytics
Required Role: Auditing Viewer (or Full Administrator)
- Log in to the Cloudera Navigator console.
- Click the Analytics tab and select HDFS from the menu. The Audit tab displays. The Metadata tab may also display if the account has the appropriate
permissions. The Source button displays in the banner section of the console if the Cloudera Navigator instance supports multiple clusters.
- Click the Source button (if it displays, meaning more than one instance) and select an HDFS instance from those available.
- The Activity tab displays a bar graph that lists the number of files that have been read the number of times listed in the x-axis.
- To display at the right the directories containing the files that have been read, click an activity bar. This draws a blue selection outline around the bar and selects the Activity checkbox.
- To select more than one value, grab a bar edge and brush a range of values.
- To change a range, click a bar, drag to a different range of values, and drop.
- To reduce a range, grab a bar edge and contract the range.
- To clear Activity, clear the checkbox. The previous selection is indicated with a gray outline.
- When you select Activity and the graph had a previous selection, the previous selection is reused. For example, if you had previously selected values spanning six through nine for the number of times files have been read, and you select the checkbox, six through nine will be reselected.
- In the directory listing on the right:
- Filter the directories by typing directory strings in the search box and pressing Enter or Return.
Required Role: Metadata & Lineage Viewer (or Managed & Custom Metadata Editor, or Full Administrator)
Add selected directories to a search query and display the Search tab by doing one of the following:- Clicking a directory name link.
- Selecting one or more directory checkboxes and selecting .
-
Required Role: Metadata & Lineage Viewer (or Managed & Custom Metadata Editor, or Full Administrator)
Add selected directories to the search query of a new policy and display the Policies tab by selecting one or more directory checkboxes and selecting .
- Filter the directories by typing directory strings in the search box and pressing Enter or Return.
For example, the following screenshot shows files that have been accessed once and match the string staging. Each directory has six files that has been
accessed.

| << Data Stewardship Dashboard | ©2016 Cloudera, Inc. All rights reserved | Using Audit Events to Understand Cluster Activity >> |
| Terms and Conditions Privacy Policy |